How to Leverage LXP Learning Analytics to Increase ROI

When you purchase an innovative Learning Experience Platform (LXP) from a reputable vendor, it comes fully equipped with all the latest tools, integrations for trouble-free interactivity. One essential feature of a LXP is its ability to seamlessly track, collect, and analyze data. We call these Learning Analytics.
When the business is ready to implement the software, learners will be able to log in, teachers can launch their virtual classrooms and administrators can assign classes to teachers. This is when LXP begin tracking data.
Your LXP will track data as soon as your learners, parents, teachers, or admin engage with the content.
LXPs collect data from three main areas:
Individual Learner Progress and Performance.
Class, Course and Curricula activity.
Teacher Training and Development.
Analyzing your LXP’s Learning Analytics is a battle-tested approach to helping educational enterprises profit from their students' success.
First Look
When we meet potential clients for the first time, two recurring pain points are brought to our attention:
- Clients are unsure of which learning analytics are available and customizable.
- Educators cannot draw accurate conclusions from the data.
Understandably, choosing the correct set of analytics to monitor and measure your educational organization's success can be tricky.
There are hundreds of Learning Analytics available on a LXP, but we’ve put together a list of 8 that will enable businesses to measure student's learning and the effectiveness of classroom teaching.
These valuable insights help increase student enrollment, client referrals, and boost product sales.
LA1: Login Activity
This metric tracks the log-in rate and frequency of students logging into the LXP. It also measures the duration of each learning session.
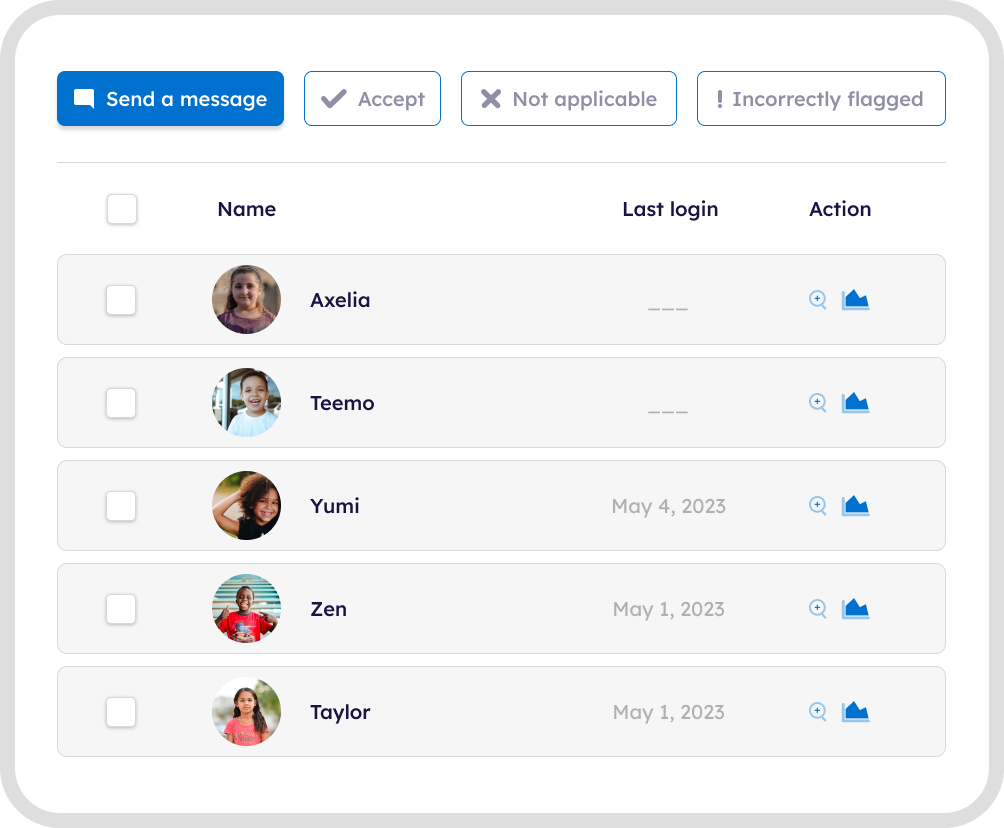
If learners fail to log in, or log in for short periods of time, they may be struggling with assignments.
Infrequent or no login activity might indicate accessibility issues, or lack of equipment, or even technical skill.
LA2: Time Spent on Activity
This metric tracks the amount of time students spend on each activity or course.
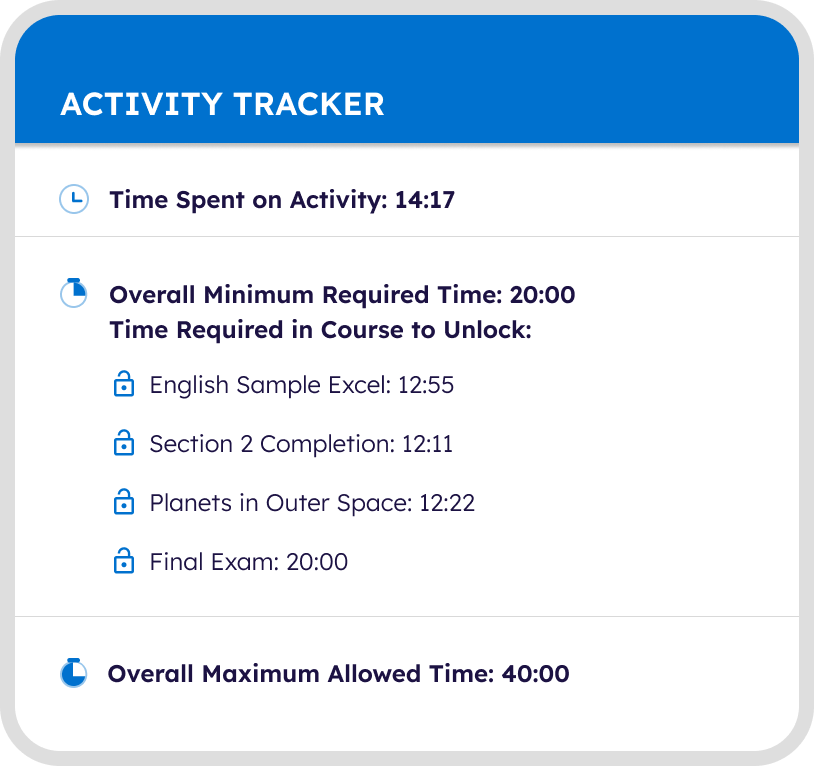
- Learners who spend too little or too much time on certain activities may find them too easy, or difficult leading to disengagement. Teachers may consider adjusting the learning level.
LA3: Rewards Leaderboard
This analytic compares learner participation, and shows which learners achieve the most rewards.
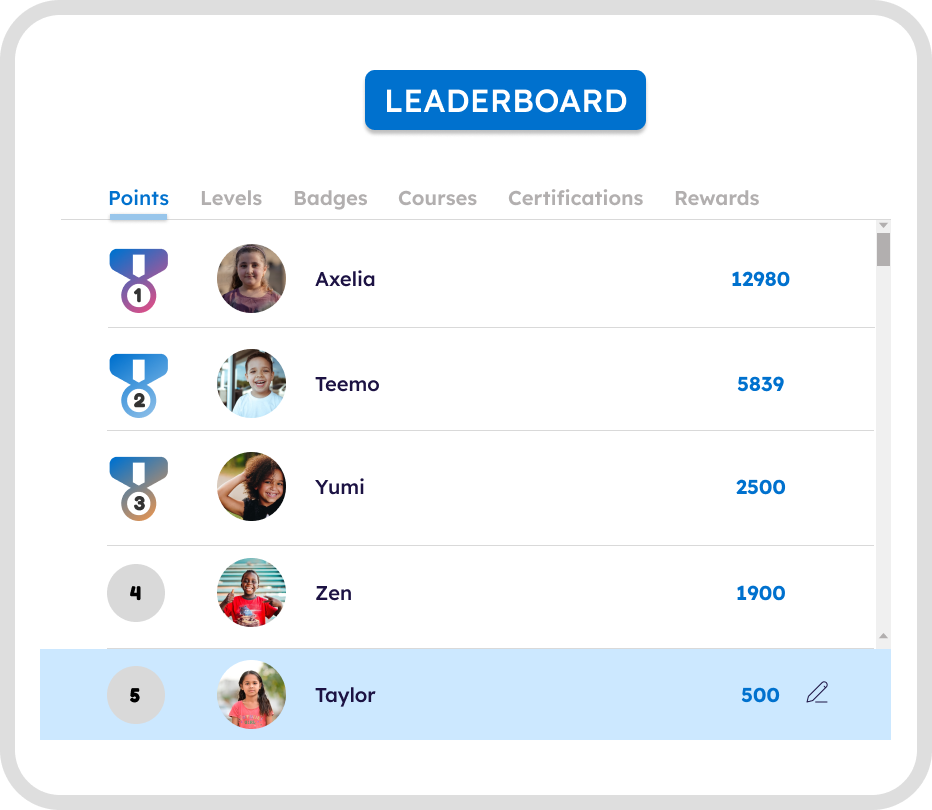
Learners who steadily increase their reward count hit their targets.
- Resetting leaderboards can increase peer competition.

LA4: Assignment Submission
This metric tracks when students begin and submit their assignments and how they interact with them over time.
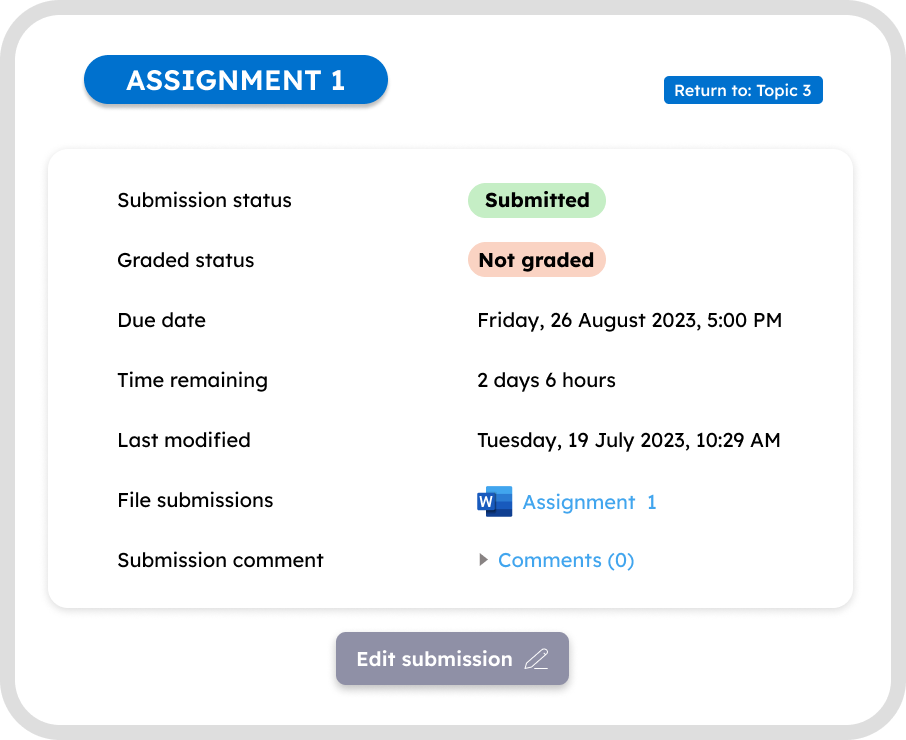
- Late submissions may indicate students are struggling with their current workload.
- It also tracks re-submissions. This is very helpful when learners make changes to their assignments based on teacher feedback.

LA5: Learning Resources Access
This metric measures who, and how frequently students access supplemental learning resources.

- Students who access additional learning resources perform better.

LA6: Assessment Results
This metric tracks how students perform on assessments. Results can be viewed as grades, points, or percentages.
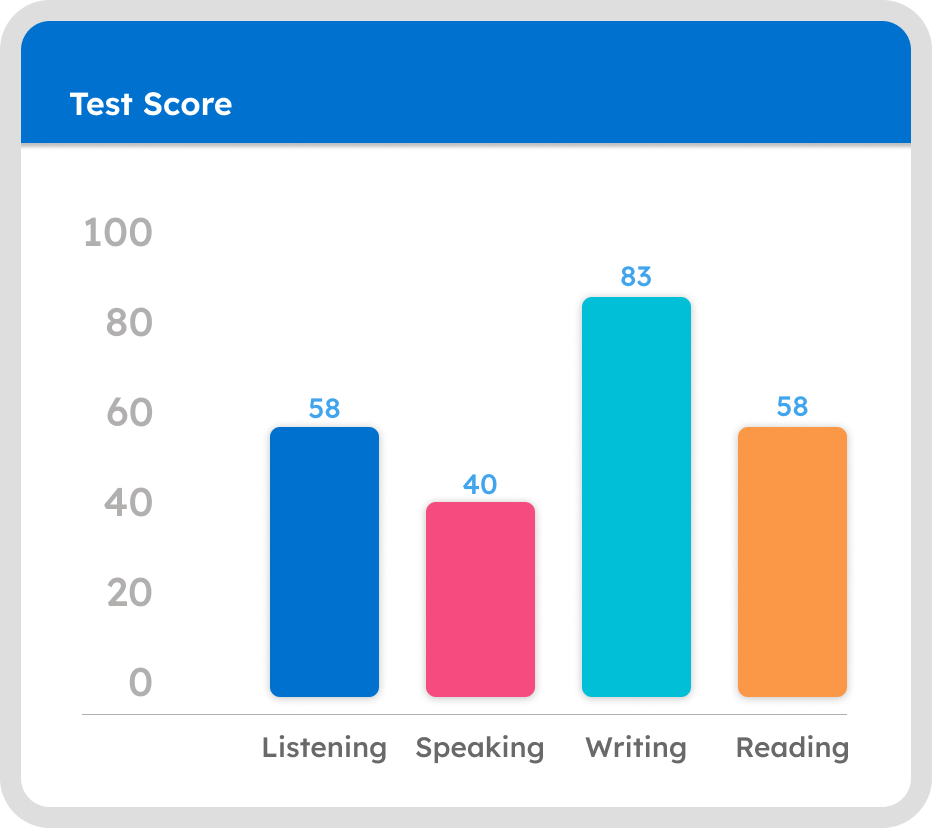
- This LA allows teachers to identify knowledge gaps and allocate additional teaching time to areas where students struggle.
This helps keep track of previous exam scores and calculates students' averages across multiple assessments.
LA7: Progress Tracking
This metric tracks a student's progress through the course.
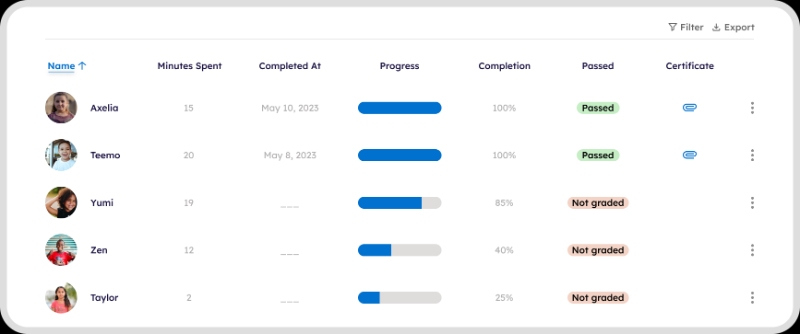
- Ensure learners progress incrementally through the course.
- Identifies parts of the course where learners may struggle.

LA8: Student Satisfaction and Re-Enrollment
This tracks the number of students who remain enrolled in a course over time.
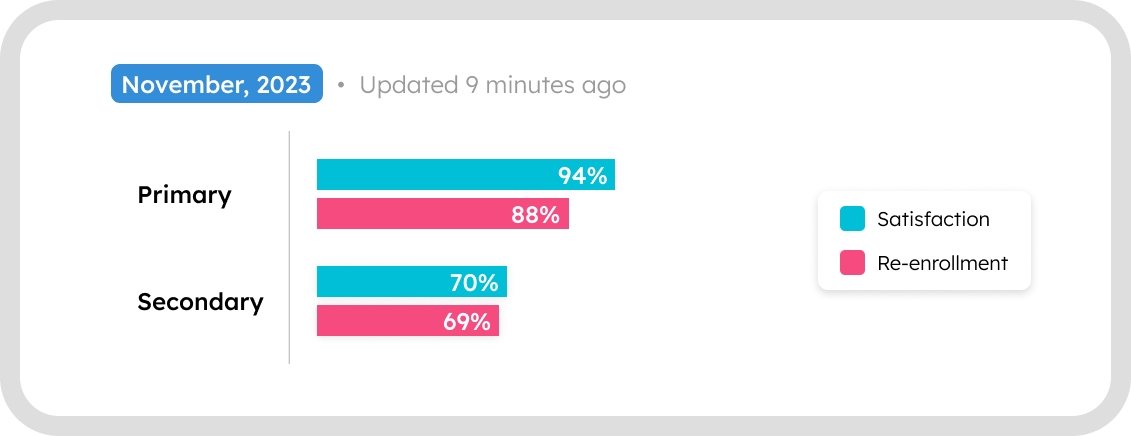
Helps keep track of new, existing, and drop-out students.
- A drop in numbers may indicate learner dissatisfaction.

Final Thoughts
These 8 analytics allow enrichment companies to monitor the effectiveness of their operations and identify areas to boost ROI.
To do this you’ll need a Fully Customizable LXP platform with built-in Learning Analytic software:
You can get that from OOOLAB with:
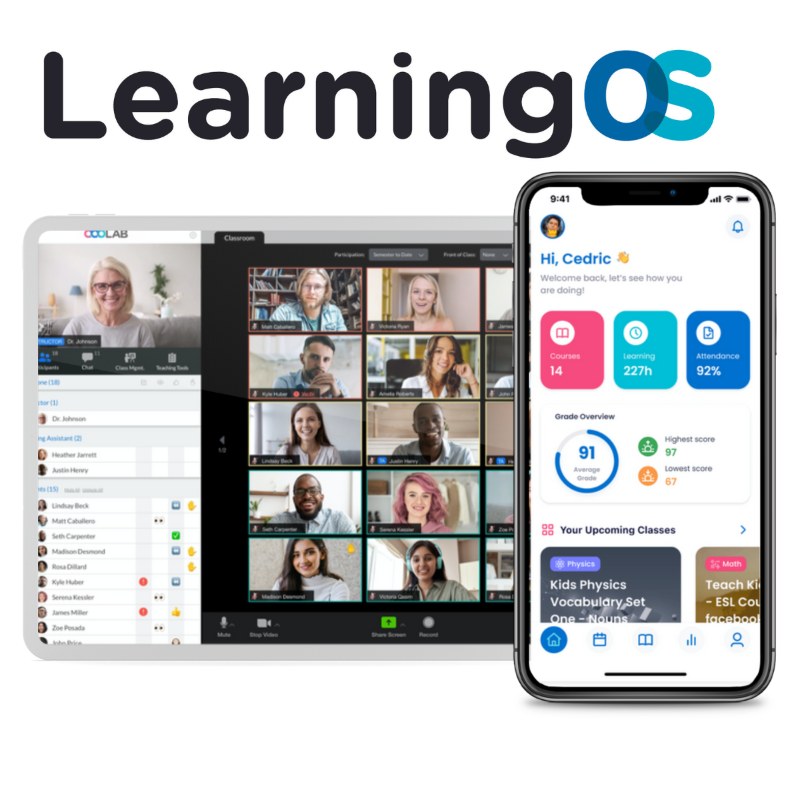
LearningOS is the #1 Learning Experience Platform for enrichment learning and contains all the learning analytics you need to gain valuable insights and increase your ROI.
OOOLAB knows each company is different, and during an onboarding session with OOOLAB our expert educational software team can configure your LXP and create organization-specific reports Learning Analytics based on your company's needs.
Schedule a demo here: LearningOS
If you're interested in how Learning Analytics can be customized as part of our white-labeling package then read this blog: 6 Reasons Why Enrichment Centers are White-Labeling their LMS (And Why You Should Too)
About us
At OOOLAB (pronounced 'uːlæb'), our mission is to make complex learning operations simple. We aim to positively impact the lives of over 1,000,000 learners and educators by the end of 2026.
OOOLAB's LearningOS provides educational institutions and corporate enterprises with an all-in-one solution to create and deliver engaging learning experiences.
Reach out to us at: Linkedin, FaceBook


